At Ofwat, we’re committed to tackling inequality and under-representation – creating an inclusive environment and reflecting the communities we serve.
Gender Pay Gap legislation (developed by the Government Equalities Office) was introduced in April 2017 and requires all organisations with 250 or more employees to publish their overall mean and median gender pay gaps. Until this year, Ofwat had fewer than 250 employees but as part of our commitment to being open and transparent about the diversity of our workforce we have voluntarily chosen to publish our gender pay gap information since 2018.
The gender pay gap refers to the difference between the average (mean or median) earnings of men and women across a workforce. It is not the same as equal pay or pay equity.
The mean gender pay gap shows the percentage gap in the average salaries of men and women based on standard hourly rates of pay during the pay period (a single month – March). The median Gender Pay Gap shows the percentage gap in the median of men and women based on standard hourly rates of pay during the pay period. The median is the middle value when all the values are ranged from highest to lowest
Historic data
Gender pay gap: 2021

The information behind the figures: understanding our gender pay gap
The gender pay gap data provides a basic understanding of what the gender pay balance looks like within Ofwat but, to improve our gender pay gap, we need to understand the specific causes of any imbalance. To help with this, we’re looking at the proportion of women and men at different pay levels.
The shape of our organisation: 2021

Gender pay gap: 2020

The shape of our organisation: 2020

Gender pay gap: 2019

The shape of our organisation: 2019

Gender pay gap 2017/18
With less than 250 employees during 2017/18, we have voluntarily chosen to publish our 2017/18 gender pay gap information this year.
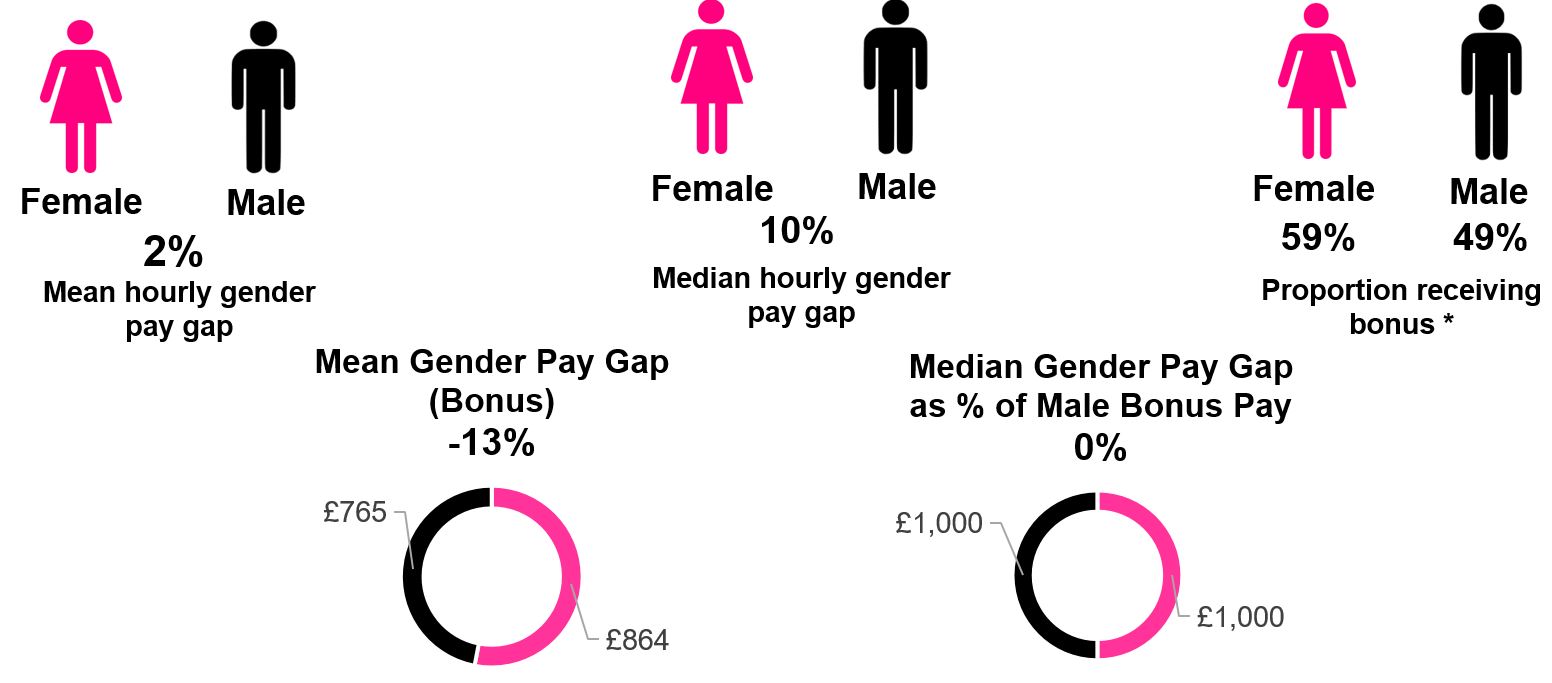
Mean is the average value, calculated by dividing the total of all the values by the number of results. Median is the mid-point/middle value, when all values are placed in ascending or descending order. (The sample size was 112 females and 120 males).
- 2% difference (in favour of males) between our average female and average male hourly pay rates.
- 10% difference (in favour of males) between the mid-points/middle values of the 2 groups
- 10% more females than males received a bonus award (*across the workforce by gender)
- Females received an average of £99 more in bonus payment than males
- The median (mid-point/middle) values for males and females were the same in terms of bonus payments
Pay by quartile
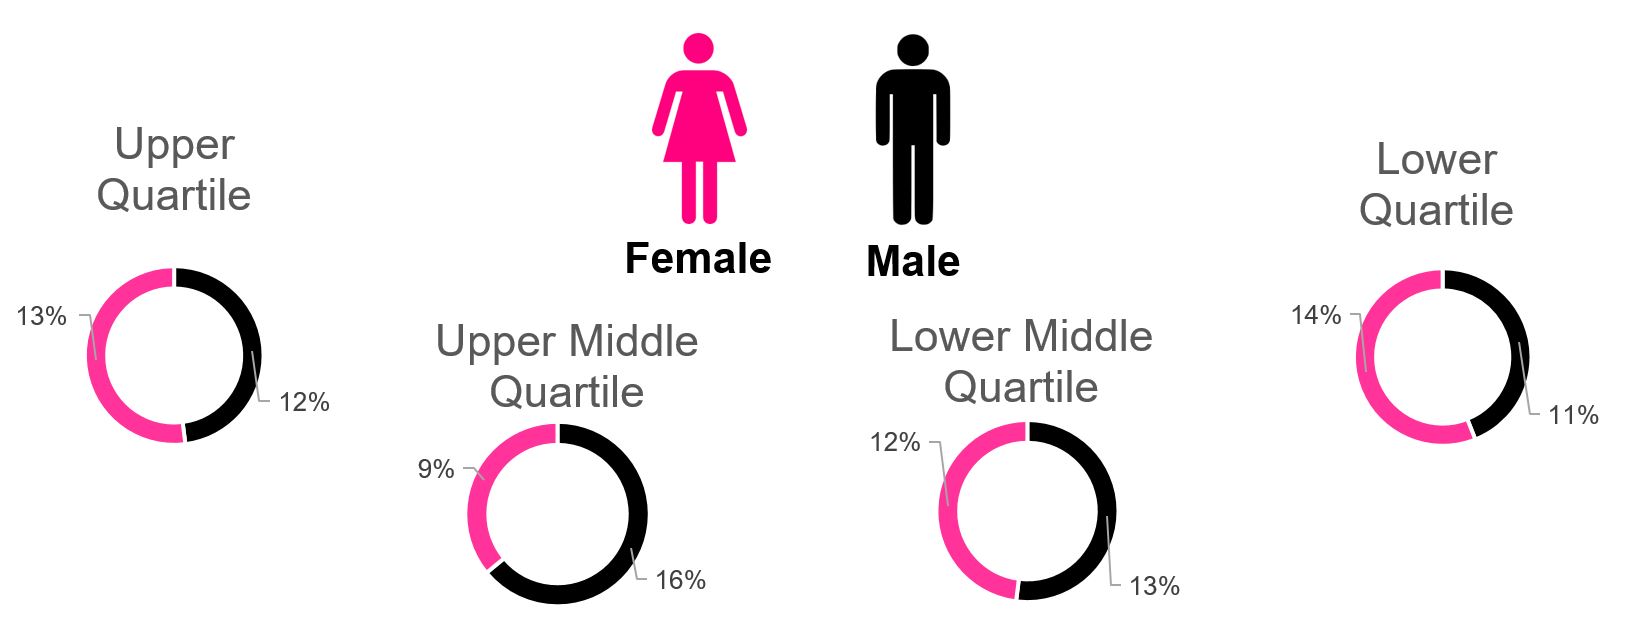
Quartiles are achieved by identifying the median value (the mid-point value where all values are listed in ascending/descending order) and then identifying the mid-point values between the lowest and median values (these become the lower and lower middle quartiles) and the highest and median values (these become the upper and upper middle quartiles).
- A 1% and 3% difference in favour of women in both the upper and lower quartiles respectively
- Upper middle and lower middle quartiles differ by 7% and 1% in favour of men, respectively
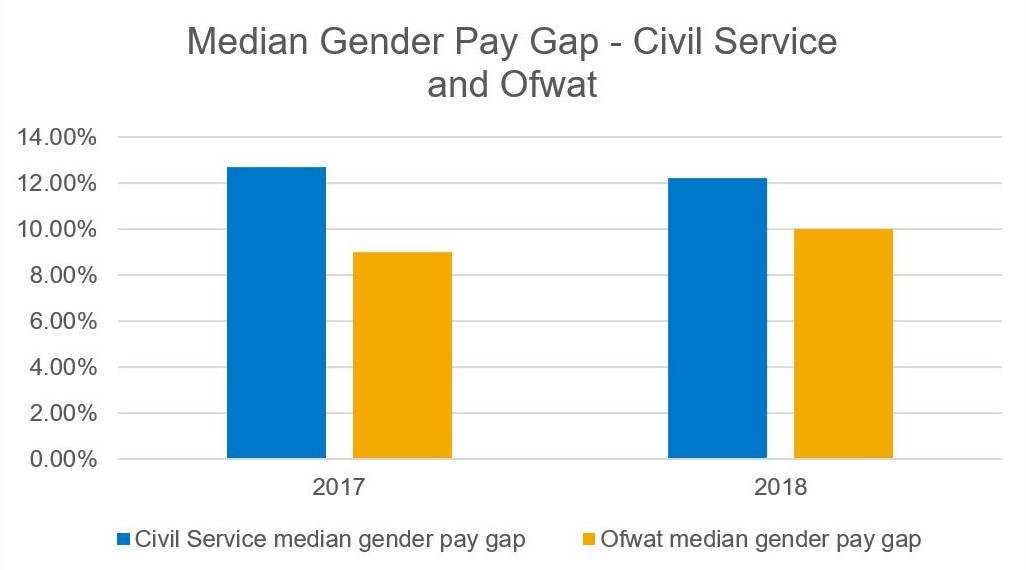
How this compares
As per the chart below, it’s encouraging to see that our figures are low in comparison to other Civil Service organisations – we currently have the lowest mean and second lowest median results: