Increasing the diversity of Ofwat, including our ethnic diversity, is a priority for us. Our EDI strategy commits us to building an organisation that is more representative of the communities we serve.
As an employer improving the diversity of our workforce aligns with our SAILOR values which set out how we behave and what we aspire to be – it is the right thing to do. Diversity of thought leads to better decision making, minimising risk, supporting innovation and creativity by bringing together different experiences, backgrounds, and skills.
We are voluntarily reporting on our ethnicity pay gap despite not being legally required to do so. As part of our commitment to being open and transparent about the diversity of our workforce. We will continue to publish this data to identify trends as we work to increase the ethnic diversity at Ofwat
While there is not yet legislation to address it, the ethnicity pay gap typically refers to the difference between average pay for Ofwat’s racially and ethnically diverse employees and their white employees.
The mean ethnicity pay gap shows the percentage gap in the average salaries of ethnically diverse employees and white employees based on standard hourly rates of pay during the pay period (a single month – March). The median ethnicity Pay Gap shows the percentage gap in the median of ethnically diverse employees compared to white employees based on standard hourly rates of pay during the pay period. The median is the middle value when all the values are ranged from highest to lowest
Historic data
Ethnicity pay gap: 2021
The information behind the figures: understanding our ethnicity pay gap
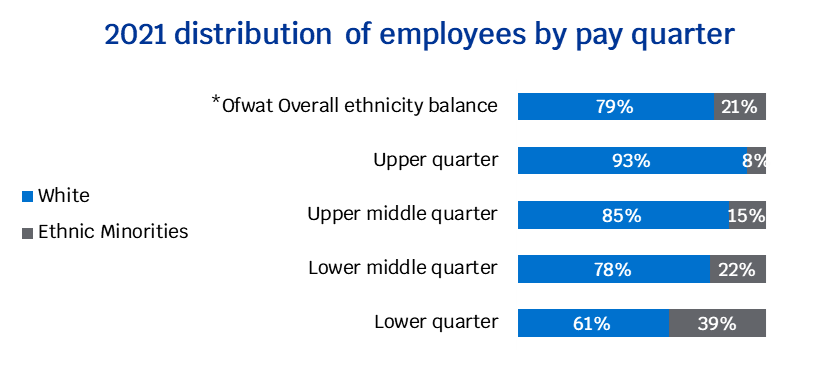
The ethnicity pay gap data provides a basic understanding of what the ethnic balance looks like within Ofwat but, to improve our ethnicity pay gap, we need to understand the specific causes of any imbalance. To help with this, it’s important to look at the proportion of ethnic minorities at different pay levels.
The shape of our organisation: 2021
- Ethnic minorities are under-represented at upper middle quarter and above (Principal, Director and Senior Director level)
- Ethnic minorities are over-represented at the lower quarter and lower middle quarter (Associate and Senior Associate level) by 14.7%
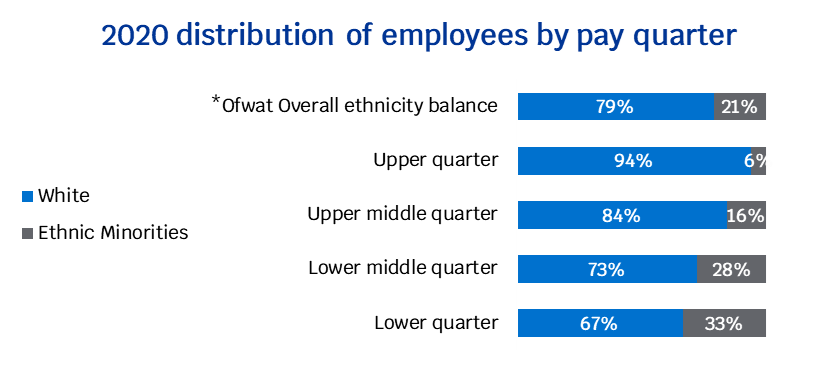
These reports represent a snapshot in time of our organisation. As a small organisation a small change will have a big impact on our pay gap. We will look at the shape of our organisation over time to identify trends as we work to increase ethnic diversity at Ofwat.
Ethnicity pay gap: 2020
The shape of our organisation: 2020


