Service incentive mechanism
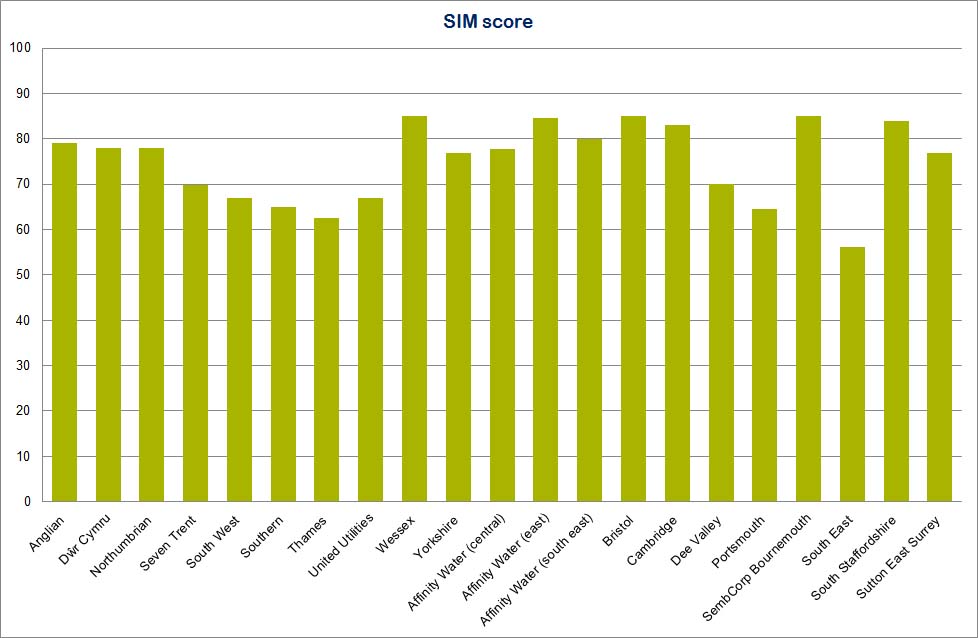
The service incentive mechanism (SIM) is designed to encourage the companies to provide better service to their customers. It also allows customers to compare the performance of their company with others.
It measures two aspects of customer service delivery:
- where customers have made contact when something has gone wrong – for example, phoning about a billing error or writing to the company to complain
- how well the companies have handled all types of customer contacts, not just when things have gone wrong (this is measured using a customer survey)
Our SIM briefing sheet (PDF) contains more information about how the mechanism works.
Each year McCallum-Layton undertake an independent assessment of the qualitative scoring for each company.
In 2011-12, the companies scored an average of 75 out of 100 for customer service. This ranged from 85 ‒ Affinity Water East (formerly Veolia East), Bristol Water, Sembcorp Bournemouth Water and Wessex Water ‒ to 56 (South East Water).
Green means the company’s performance is in line with or better than expected
Amber means the company’s performance is not in line with expectations but performance has slipped only slightly
Red means the company’s performance is significantly below target or expectation
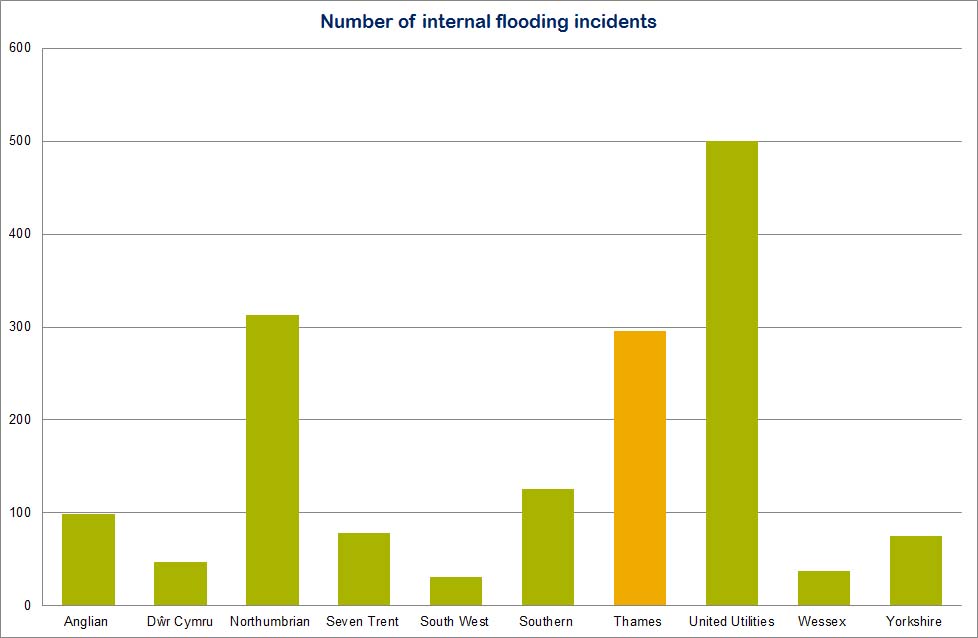
Internal sewer flooding incidents
Sewer flooding is flooding caused by an escape of sewage from a sewer. It can occur on all sewers due to an operational problem such as a blockage or collapse. It can also occur on combined sewers (which carry sewage and surface water) when the capacity of the sewer is exceeded due, for example, to heavy rainfall. It should not be confused with fluvial flooding which occurs when water courses, such as rivers, overflow. Sewer flooding is considered the worst service failure but, fortunately, it affects comparatively few people. Out of 24 million properties connected to the sewerage system only 5,600 were flooded internally in 2011 (0.02%).
It is not cost effective to prevent all sewer flooding. No matter how big companies build sewers, there will always be some severe weather events that will inundate them. As an example it would not be cost effective to put in very large combined sewers to cope with a storm that may only occur once in 100 years when most of the time the sewer would run virtually empty. Companies must therefore make sure that the costs of a solution do not outweigh the benefits to the customers concerned and the costs to all other customers (such as the environmental and social impacts of digging up the roads). This does not necessarily mean that nothing can be done; companies can mitigate the effect of flooding to properties where a permanent solution is prohibitively expensive.
Green means the company’s performance is in line with or better than expected
Amber means the company’s performance is not in line with expectations but performance has slipped only slightly
Red means the company’s performance is significantly below target or expectation
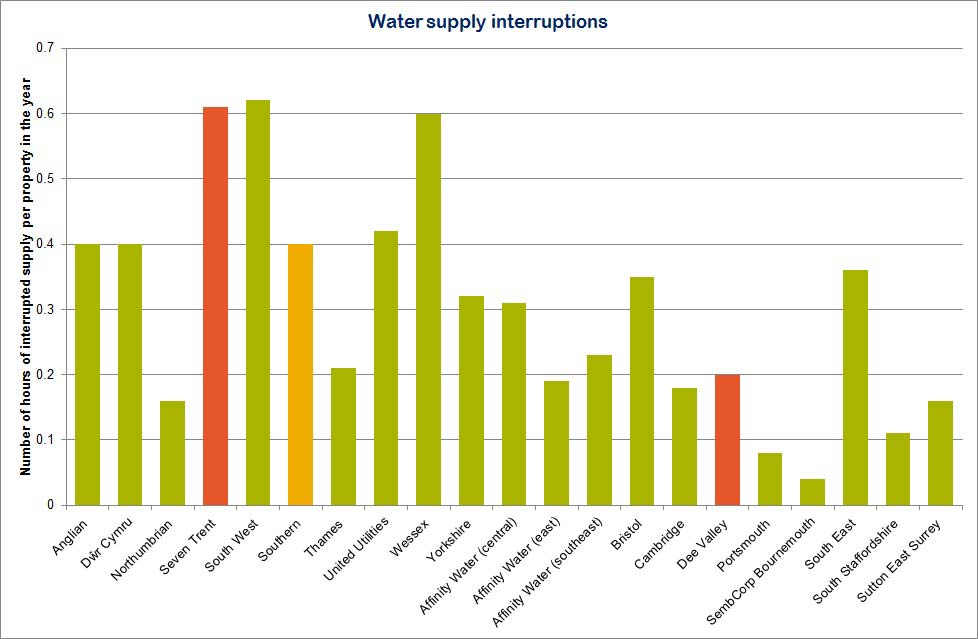
Water supply interruptions
It is important that water companies deliver a reliable water supply to customers. This KPI measures the number of hours lost due to water supply interruptions for three hours or longer, per property served. All causes of interruption are included within this indicator, whether they are planned, unplanned or caused by a third party.
In some circumstances when water supply is interrupted, customers are entitled to compensation under the guaranteed standards scheme.
Green means the company’s performance is in line with or better than expected
Amber means the company’s performance is not in line with expectations but performance has slipped only slightly
Red means the company’s performance is significantly below target or expectation
Data
| SIM Score | Internal sewer flooding incidents | Water supply interruptions – hours per total properties served | |
|---|---|---|---|
| Anglian | 79 | 99 | 0.4 |
| Dŵr Cymru | 78 | 47 | 0.4 |
| Northumbrian | 78 | 313 | 0.16 |
| Severn Trent | 70 | 78 | 0.61 |
| South West | 67 | 31 | 0.62 |
| Southern | 65 | 126 | 0.4 |
| Thames | 63 | 296 | 0.21 |
| United Utilities | 67 | 500 | 0.42 |
| Wessex | 85 | 37 | 0.6 |
| Yorkshire | 77 | 75 | 0.32 |
| Affinity Water* (central) | 78 | — | 0.31 |
| Affinity Water* (east) | 85 | — | 0.19 |
| Affinity Water* (southeast) | 80 | — | 0.23 |
| Bristol | 85 | — | 0.35 |
| Cambridge | 83 | — | 0.18 |
| Dee Valley | 70 | — | 0.2 |
| Portsmouth | 65 | — | 0.08 |
| Sembcorp Bournemouth | 85 | — | 0.04 |
| South East | 56 | — | 0.36 |
| South Staffs | 84 | — | 0.11 |
| Sutton & East Surrey | 77 | — | 0.16 |
Green means the company’s performance is in line with or better than expected
Amber means the company’s performance is not in line with expectations but performance has slipped only slightly
Red means the company’s performance is significantly below target or expectation
Blue means companies did not have to submit this data
*Formerly Veolia Water Central, Veolia Water East and Veolia Water Southeast.
| Back to additional data about companies’ performance 2011-12 main page |