Greenhouse gas emissions
Companies are expected to manage their greenhouse gas emissions so that they can deliver their core services in a low carbon way and to play their part in reducing national greenhouse gas emissions where it is economic to do so and in customers’ interest.
All operations can result in emissions, including:
- operational use of assets
- vehicle movements
- pumping of water around the network
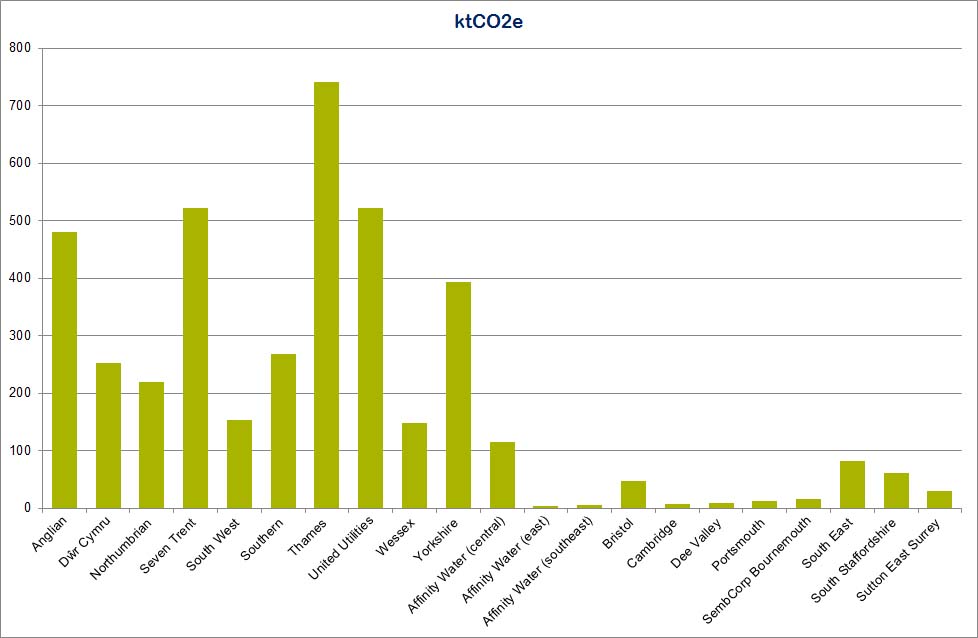
The size of a company can have a big influence on operational emissions of a company, for example a large company operates more assets and pumps more water than a smaller company. Topography and weather conditions can also impact annual operation emissions.
Companies monitor these operating emissions and report them annually. The graph below shows companies’ operational emissions, in thousands of tonnes of carbon dioxide equivalent.
In addition to operating emissions there are those associated with materials, manufactured products and processes involved in the construction and disposal of an asset (embedded emissions). While this indicator does not capture these, they are also an important consideration for companies.
Green means the company’s performance is in line with or better than expected
Amber means the company’s performance is not in line with expectations but performance has slipped only slightly
Red means the company’s performance is significantly below target or expectation
Pollution
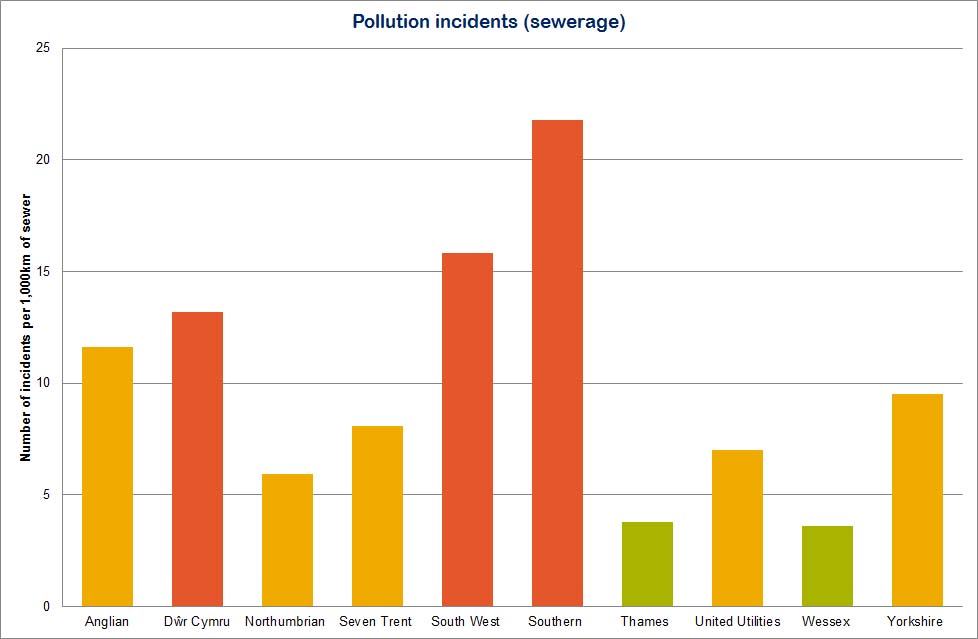
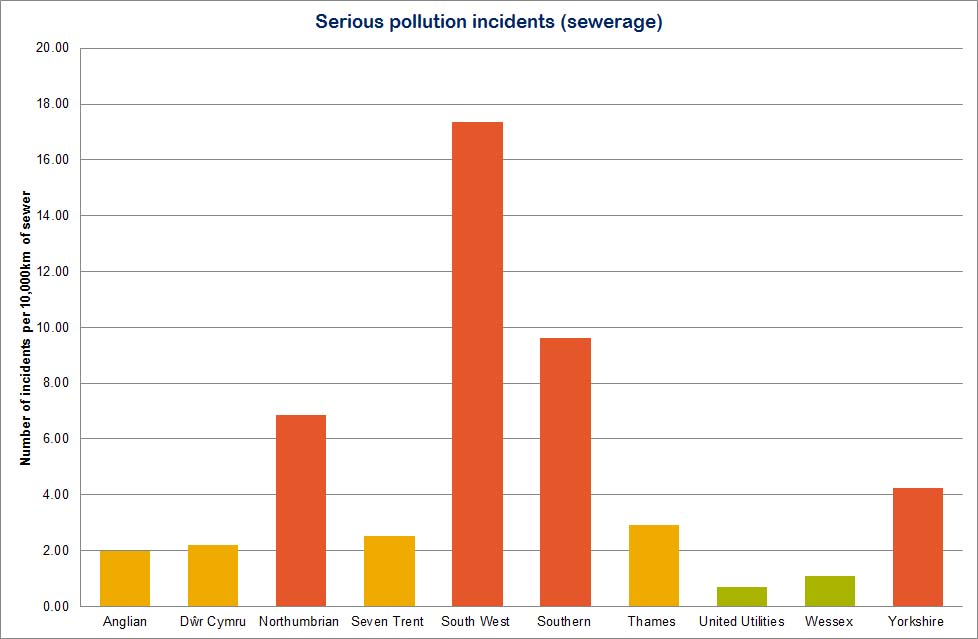
The water and the sewerage sectors can have a significant impact on the environment. For example, poorly maintained sewers can lead to the discharge of raw sewage into a river. The water and sewerage companies have a number of duties for example, to maintain sewers and lateral drains so as to effectually drain its area, and to deal effectually with the contents of sewers.
The Environment Agency are the regulatory body responsible for monitoring pollution. We worked with them to develop four key indicators. We do not take regulatory action against these indicators.
Green means the company’s performance is in line with or better than expected
Amber the company’s performance is not in line with expectations but performance has slipped only slightly
Red means the company’s performance is significantly below target or expectation
Green means the company’s performance is in line with or better than expected
Amber means the company’s performance is not in line with expectations but performance has slipped only slightly
Red means the company’s performance is significantly below target or expectation
Green means the company’s performance is in line with or better than expected
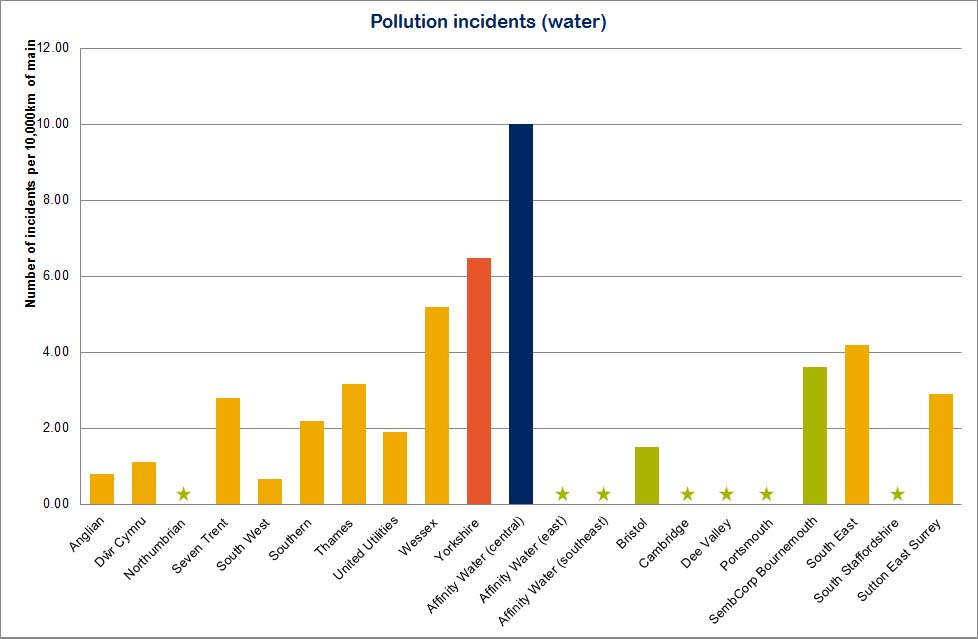
Green star means the company had no water pollution incidents and the company’s performance is in line with or better than expected
Amber means the company’s performance is not in line with expectations but performance has slipped only slightly
Red means the company’s performance is significantly below target or expectation
Affinity Water (central) did not record a red, amber or green status for this indicator

Green means the company’s performance is in line with or better than expected
Amber means the company’s performance is not in line with expectations but performance has slipped only slightly
Red means the company’s performance is significantly below target or expectation
Sludge
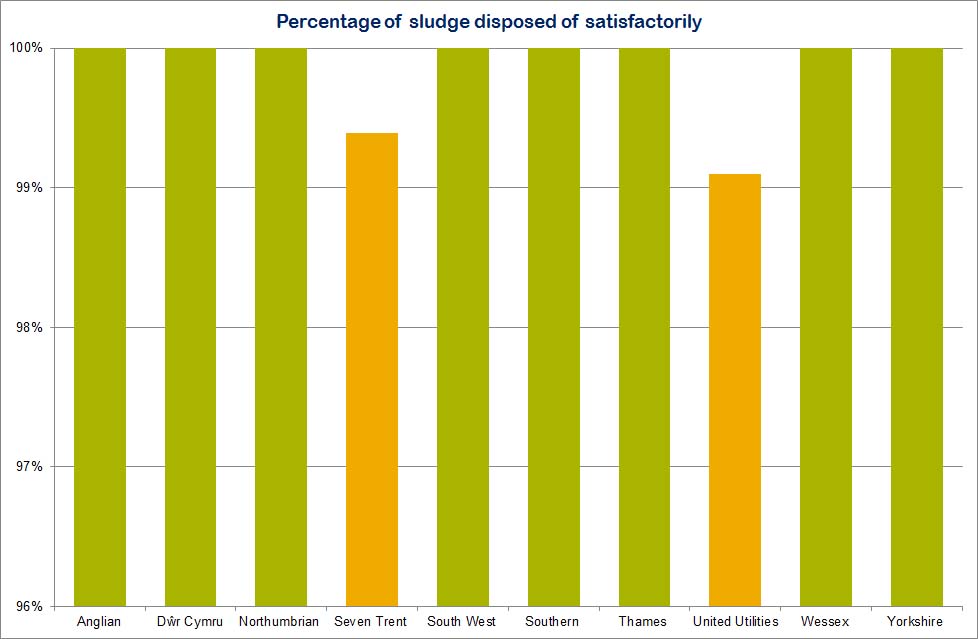
This indicator measures how well water and sewerage companies have met the requirements for satisfactory sludge disposal as set out in regulations and codes of practice such as the safe sludge matrix and nitrate vulnerable zone restrictions. For example water and sewerage companies have a responsibility to treat sludge to a suitable standard before it can be applied to agricultural land. Because of the varied requirements and disposal routes, the definition of satisfactory disposal may be different for each company.
In the graph below, 100% means that all sludge disposed of during the year was in line with the company’s processes for satisfactory disposal.
Green means the company’s performance is in line with or better than expected
Amber means the company’s performance is not in line with expectations but performance has slipped only slightly
Red means the company’s performance is significantly below target or expectation
Data
| Greenhouse gas (GHG) emissions | Pollution incidents sewerage | Serious pollution incidents sewerage | Pollution incidents (water) | Discharge permit compliance | Satisfactory sludge disposal | |
|---|---|---|---|---|---|---|
| Anglian | 481 | 11.6 | 2.0 | 0.8 | 97% | 100% |
| Dŵr Cymru | 252 | 13.2 | 2.2 | 1.1 | 96% | 100% |
| Northumbrian | 220 | 5.9 | 6.9 | 0.0 | 99% | 100% |
| Severn Trent | 522 | 8.1 | 2.5 | 2.8 | 97% | 99% |
| South West | 153 | 15.9 | 17.4 | 0.7 | 92% | 100% |
| Southern | 268 | 21.8 | 9.6 | 2.2 | 96% | 100% |
| Thames | 741 | 3.8 | 2.9 | 3.2 | 100% | 100% |
| United Utilities | 522 | 7.0 | 0.7 | 1.9 | 99% | 99% |
| Wessex | 149 | 3.6 | 1.1 | 5.2 | 100% | 100% |
| Yorkshire | 394 | 9.5 | 4.3 | 6.5 | 97% | 100% |
| Affinity Water* (central) | 116 | — | — | 10 | — | — |
| Affinity Water* (east) | 3 | — | — | 0.0 | — | — |
| Affinity Water* (southeast) | 6 | — | — | 0.0 | — | — |
| Bristol | 47 | — | — | 1.5 | — | — |
| Cambridge | 7 | — | — | 0.0 | — | — |
| Dee Valley | 10 | — | — | 0.0 | — | — |
| Portsmouth | 13 | — | — | 0.0 | 100% | — |
| Sembcorp Bournemouth | 17 | — | — | 3.6 | — | — |
| South East | 83 | — | — | 4.2 | — | — |
| South Staffs | 62 | — | — | 0.0 | — | — |
| Sutton & East Surrey | 31 | — | — | 2.9 | — | — |
Green means the company’s performance is in line with or better than expected
Amber means the company’s performance is not in line with expectations but performance has slipped only slightly
Red means the company’s performance is significantly below target or expectation
Blue means companies did not have to submit this data
*Formerly Veolia Water Central, Veolia Water East and Veolia Water Southeast.