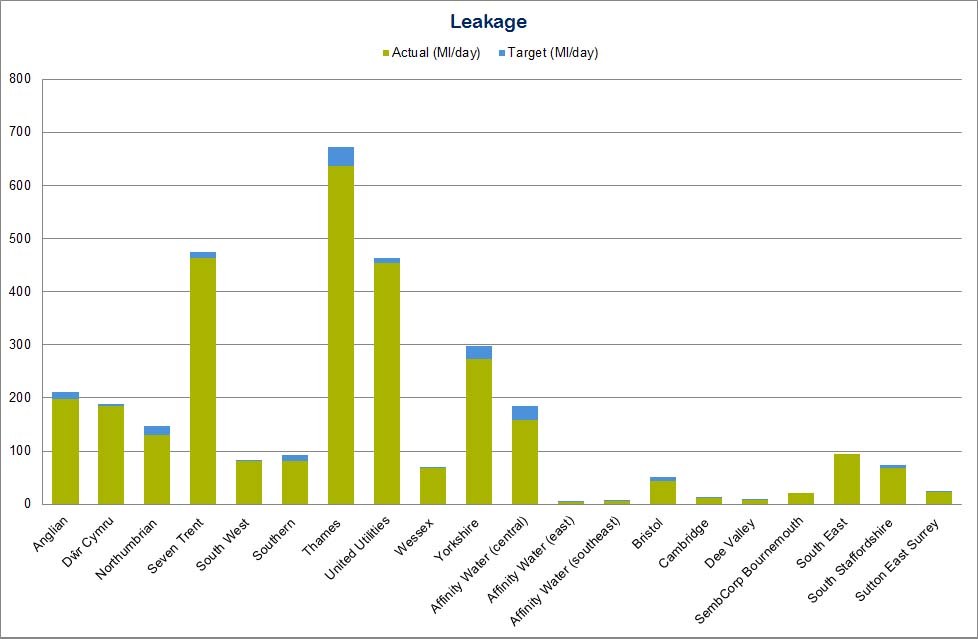
Leakage
Customers care about levels of leakage. At the 2009 price review they identified it as their second most important issue behind affordable bills.
Reducing leakage is just one way companies can help balance supply and demand. It is part of a best value package including promoting efficient use of water, metering or developing new sources of raw water. Companies calculate the appropriate levels of leakage as part of the water resources management plans and take in to account social and environmental costs and benefits such as disruption to traffic or additional carbon emissions.
We challenge the companies to operate at the sustainable, economic level of leakage (SELL) by setting them annual leakage targets (shown in blue in the graph below). The SELL is set at the level where reducing leakage further is more expensive than balancing supply and demand through an alternative measure.
Companies have very different sustainable, economic levels of leakage. There are a combination of factors affecting the SELL including
- the size and condition of the asset base
- the predominant soil type of the region
- operating pressures
- the ratio of urban to rural populations
- the pressures on water resources
Because of this we hold companies to account for their level of leakage compared to their own target and do not compare performance between companies.
Portsmouth Water have notified us that the level of leakage originally reported for 2011-12 was inaccurate. We are currently working with Portsmouth Water to understand the reasons for this. And so we have not included Portsmouth Water in the graph or data below.
Green means the company’s performance is in line with or better than expected
Amber means the company’s performance is not in line with expectations but performance has slipped only slightly
Red means the company’s performance is significantly below target or expectation
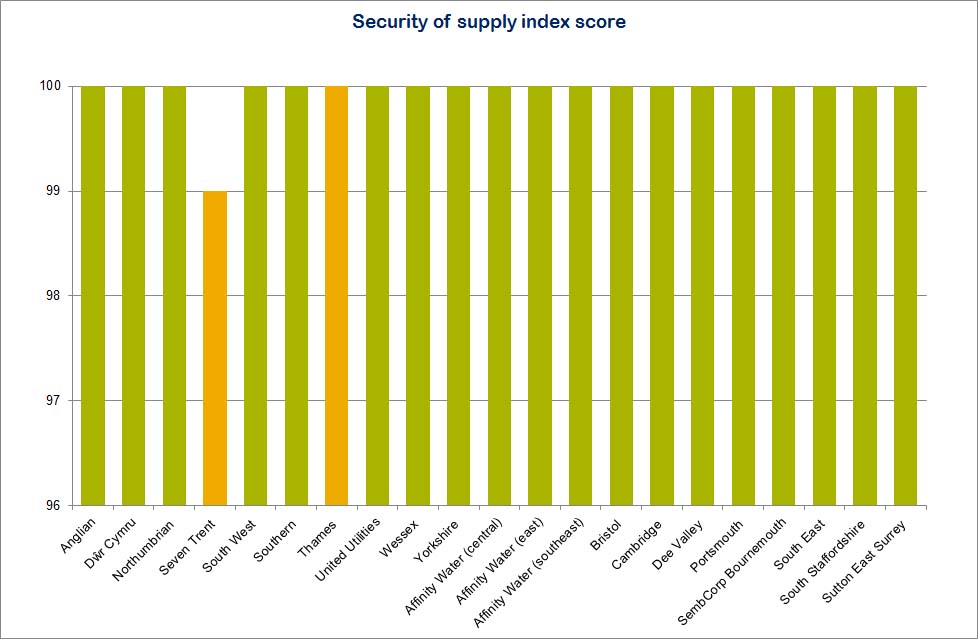
Security of supply
Each company has a duty to maintain the security of its water supplies. The security of supply index (SOSI) is used to assess each company’s compliance with this duty.
When calculating their index scores, companies make assumptions about the levels of service they expect to provide to their customers. They cover their expectations about the frequency and duration of restrictions on use, such as temporary restrictions on customers’ non-essential water usage, during dry years. Therefore the index takes into account that there may be restriction on water use at certain points in time during dry years. As a result it is possible for a water company to have a 100% security of supply index at the same time as requiring water restrictions such as hosepipe bans.
Each company calculates an index score where 100 is the maximum – a secure supply. A company can have a score of 100 but still have an amber rating if they have concerns about being able to meet their target next year.
Green means the company’s performance is in line with or better than expected
Amber means the company’s performance is not in line with expectations but performance has slipped only slightly
Red means the company’s performance is significantly below target or expectation
Serviceability
Each company is required to maintain its assets to a defined standard so that it can provide reliable services to customers over the long term ‒ and protect the environment. We call this ‘stable serviceability’.
Serviceability is a regulatory tool that measures and confirms that capital maintenance outputs have been delivered for customers and the environment. Performance is measured through 20 indicators which are grouped into to four sub-services:
- serviceability water non-infrastructure (for example water treatment works) (5 indicators)
- serviceability water infrastructure (for example underground water mains) (6 indicators)
- serviceability for sewerage non-infrastructure (for example sewerage treatment works) (3 indicators)
- serviceability sewerage infrastructure ( for example underground networks sewers) (6 indicators)
Each company makes a judgement about the overall serviceability in each sub-service and updates the serviceability status as either improving, stable, marginal or deteriorating. We will make our own assessment of serviceability as part of the 2014 price review.
Data
| Serviceability water non-infrastructure | Serviceability water infrastructure | Serviceability for sewerage non-infrastructure | Serviceability sewerage infrastructure | Leakage (target in Ml/day) |
Leakage (actual in Ml/day) |
Security of supply index (SoSI) | |
|---|---|---|---|---|---|---|---|
| Anglian | Stable | Stable | Stable | Marginal | 212 | 199 | 100 |
| Dŵr Cymru | Stable | Stable | Marginal | Stable | 188 | 185 | 100 |
| Northumbrian | Stable | Stable | Stable | Stable | 147 | 130 | 100 |
| Severn Trent | Stable | Marginal | Stable | Stable | 474 | 464 | 99 |
| South West | Stable | Stable | Stable | Stable | 84 | 81 | 100 |
| Southern | Stable | Stable | Stable | Stable | 93 | 82 | 100 |
| Thames | Stable | Stable | Stable | Stable | 673 | 637 | 100 |
| United Utilities | Stable | Stable | Improving | Marginal | 464 | 453 | 100 |
| Wessex | Stable | Stable | Stable | Stable | 71 | 69 | 100 |
| Yorkshire | Stable | Marginal | Stable | Stable | 297 | 274 | 100 |
| Affinity Water* (central) | Stable | Stable | — | — | 185 | 158 | 100 |
| Affinity Water* (east) | Stable | Stable | — | — | 5.1 | 4 | 100 |
| Affinity Water* (southeast) | Stable | Stable | — | — | 7.8 | 7 | 100 |
| Bristol | Stable | Stable | — | — | 51 | 43 | 100 |
| Cambridge | Stable | Stable | — | — | 14 | 12 | 100 |
| Dee Valley | Stable | Marginal | — | — | 10.2 | 9 | 100 |
| Portsmouth | Stable | Stable | — | — |
** |
** |
100 |
| Sembcorp Bournemouth | Stable | Stable | — | — | 22 | 22 | 100 |
| South East | Stable | Marginal | — | — | 95 | 95 | 100 |
| South Staffs | Stable | Stable | — | — | 74 | 68 | 100 |
| Sutton & East Surrey | Stable | Stable | — | — | 25 | 24 | 100 |
Green means the company’s performance is in line with or better than expected
Amber means the company’s performance is not in line with expectations but performance has slipped only slightly
Red means the company’s performance is significantly below target or expectation
Blue means companies did not have to submit this data
*Formerly Veolia Water Central, Veolia Water East and Veolia Water Southeast.
**Portsmouth Water have notified us that the level of leakage originally reported for 2011-12 was inaccurate. We are currently working with Portsmouth Water to understand the reasons for this. And so we have not included Portsmouth Water data.